Disclaimer: None of the authors, Mei Lab, or Chinese Institutes for Medical Research assume any liabilities for these protocols. Use at your own risk. Our goal for these protocols is to disseminate open source techniques commonly used in the Mei Lab. However, these protocols do not assume any guarantees of correctness and should be implemented using safety protocols, provisions and permissions of the universities with which the users are operating within. Lastly, these protocols are distributed in the hope that it will be helpful, however without any warranty or desire of merchantability.
It is requested that any use of these protocols be cited in methods sections as “Mei Lab Protocols” + “Specific Protocol Name” along with website “meilab.org/protocols”.
Our lab employs a variety of cutting edge molecular and electrophysiological that encompass both in vivo and in vitro systems. Some examples of these techniques are displayed below.
Biochemical Techniques
Liquid-liquid phase separation
Western Blot (Phospho-blot)
Example of liquid-liquid phase separation.
Western blot measuring phospo-ErbB4 in wildtype and chemogentic (T796G).
In Vitro Techniques
Virus tracing
Immunohistochemistry
Slice recording electrophysiology
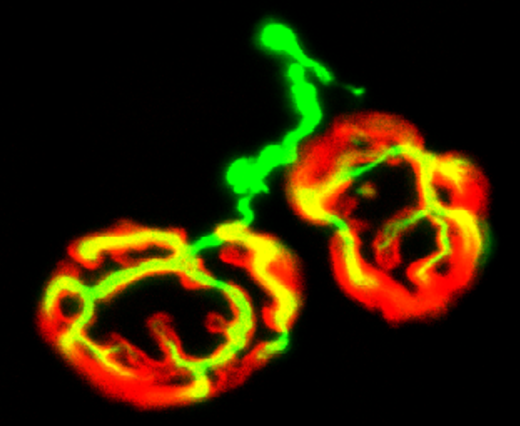
Injection of AAV-DIO-TVA-G-EYFP and Rabies-ΔG-mCherry in ErbB4-CreER mPFC with retrogradely labeled neurons in the ventral hippocampus.
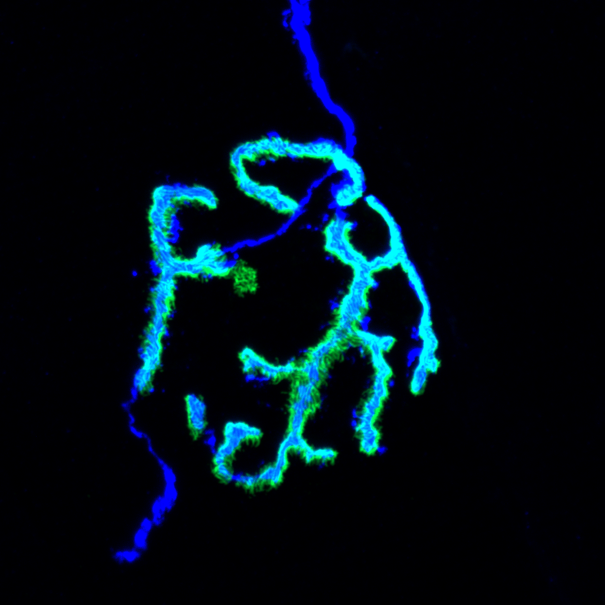
Staining of neuron fibers (green) innervating Neuromuscular Junctions
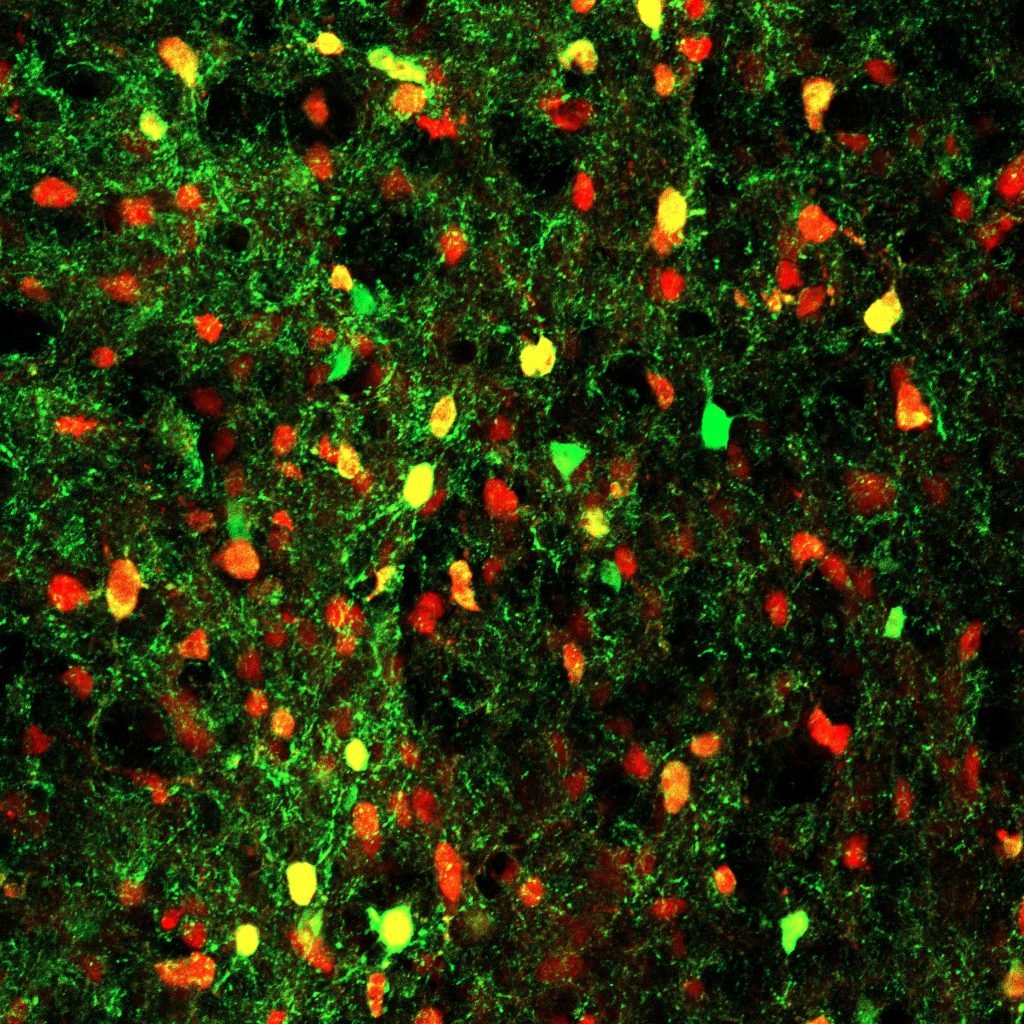
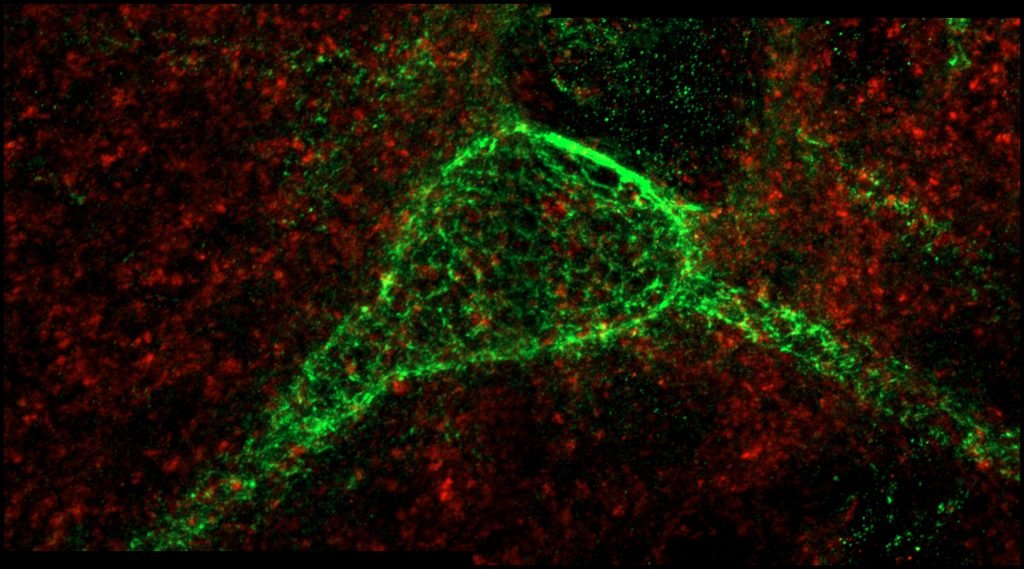
Staining of ErbB4 positive (red) and PV positive (green) interneurons
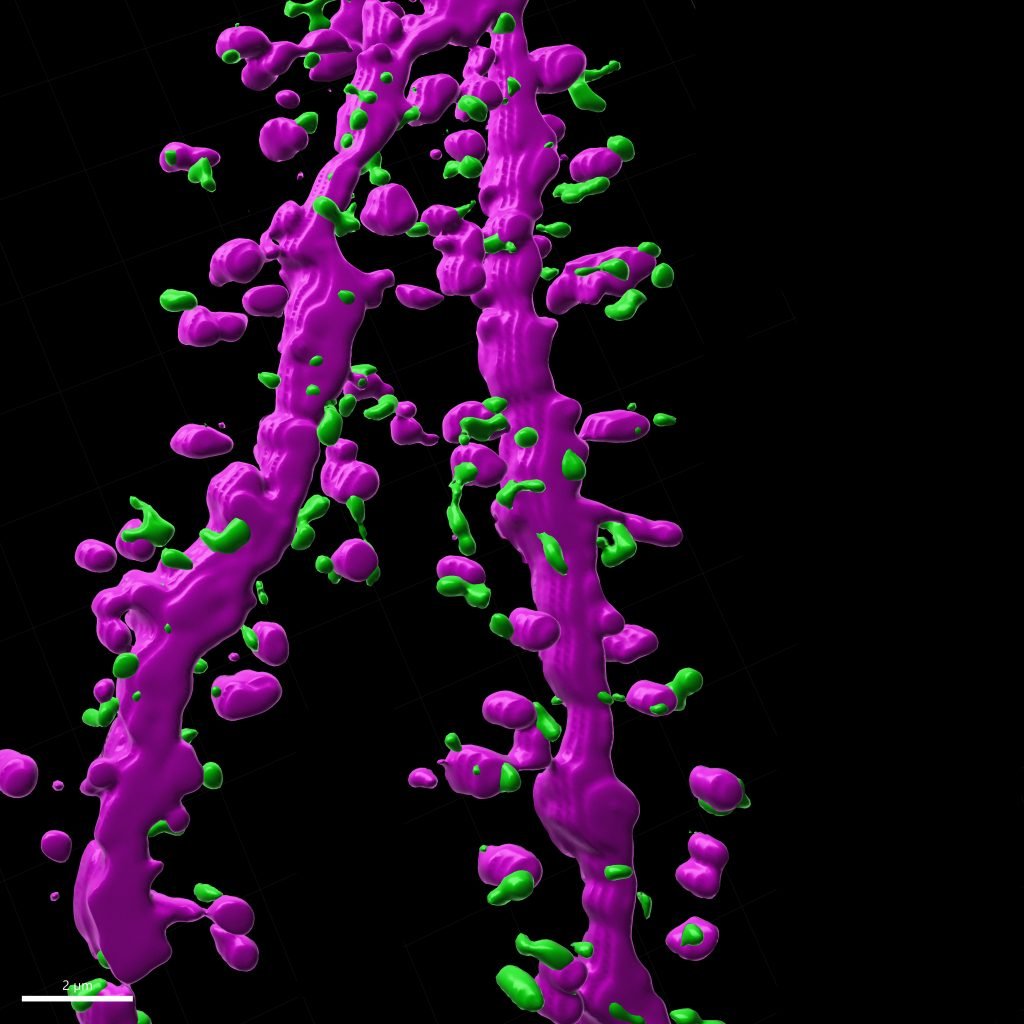
The cover depicts a 3D image of bassoon clusters of dopaminergic neurons (green) apposing on the dendrites or spines of medium spiny neurons (purple) in nucleus accumbens.
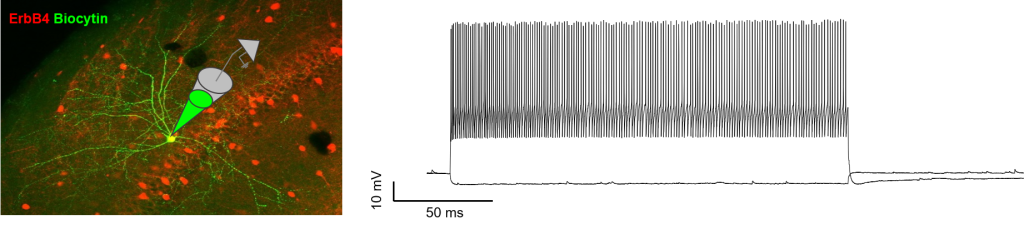
ErbB4 positive chandelier cell injected with biocytin and reconstructed (left) and firing traces (right).
In vivo Techniques
Calcium imaging
Behavior
Electrode (tetrode) recording of live animals
Video of animal performing attention behavior from our recent publication (Tan et al. Neuron 2018).
Calcium Imaging of neurons from mice with Inscopix Miniscope
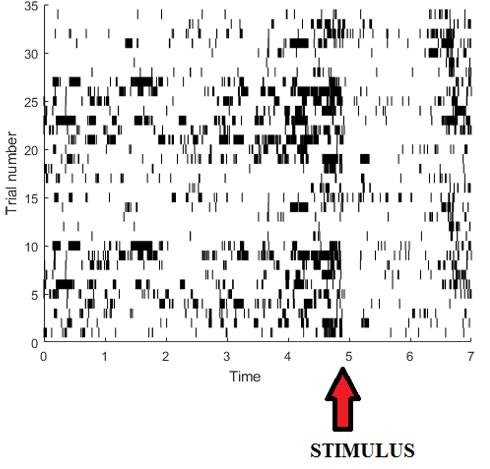
Raster plot displaying single unit firing from neuron increased upon stimulus presentation (red arrow).
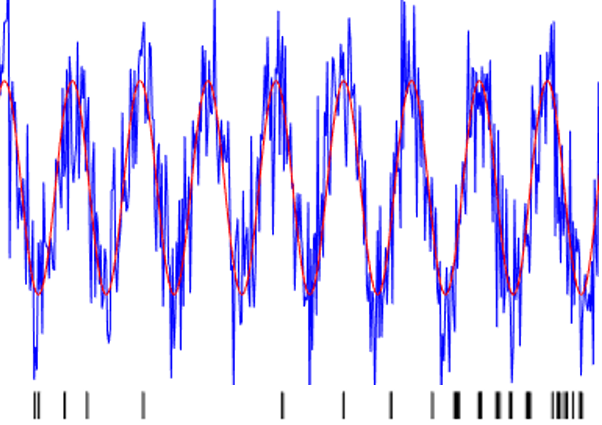
Local field potential displaying theta wave oscillations in the hippocampus during animal movement (raw blue, filtered red) with single neuron firing rate below (black tick marks).